Configuring and Parameterising FarmAC
Configuring
and Parameterising FarmAC.. 1
1 Contents. 1
2 Introduction. 1
3 Configuration. 2
3.1 Agro-ecological zone. 2
3.2 Crops. 2
3.3 Soil type. 2
3.4 Livestock and manure management 2
4 Parameterisation. 3
4.1 Parameter files. 3
4.2 Editing XML files. 4
5 Appendix Details of parameter files. 6
5.1 Constants.xml 6
5.2 Feedstuff.xml 8
5.3 FerMan.xml 9
5.4 Parameters.xml 10
5.5 Sources. 18
5.5.1 Climate data. 18
5.5.2 Crop parameters. 23
From within the FarmAC web-based interface, it is possible
to describe a wide range of farms. This includes the agricultural land (areas,
soil types, crops etc.), livestock (type of ruminants, their feed rations,
their housing and associated manure storage) and fertilisation and manuring of
crops. The choices available to the user to describe their farms depend on the
Agro-ecological zone they select. The choices available are read from a
database on the Internet server and for the foreseeable future, the only way to
add, subtract or modify these choices is to contact the webmaster (Margit) by email.
When requesting that a new choice of crop, livestock etc. be
made available, it is often necessary to provide several items of information.
The items of information that need to be provided are specified below.
The only information required is the name of the zone.
However, all aspects of the farm (crops, soils, livestock etc.) are ordered
individually for each AEZ, so if you define a new AEZ, you will need to
parameterise all these components. Fortunately, it is not necessary to define a
new AEZ very often and only needs to be done once.
For a new crop, it is necessary to supply:
·
A
name. If you wish the crop to be treated as established (e.g. permanent grass)
then the name must contain the key text 'Permanent'.
·
One
or more primary crop products from which the user will choose just one. For
grain crops, this would normally be grain. It is possible to provide more than
one quality of grain (e.g. spring barley, high protein; spring barley low
protein). Likewise for roughage crops (e.g. high quality grass silage, low
quality grass silage).
·
Whether
the primary crop product can be grazed.
·
One
or more secondary crop product from which the user will choose just one. For
grain crops, this would normally be straw. As for the primary product, it is
possible to provide more than one quality.
·
Whether
the secondary crop product can be grazed, harvested, incorporated into the
soil, burnt or whether the remaining stubble can be burnt.
Certain crops, principally associated with small-scale farms
in developing countries, crop residues may be left on the field after
harvesting and used in situ as roughage for ruminant livestock. These
crop products must have a name that includes the key text 'residue'.
Only the name is required.
The main function of the livestock modelling is to estimate
production, losses of C (CH4 and CO2) and excretion. The
feed ration for each livestock group must be input by the user; the feed items
available are specific to an AEZ and will include the crop products defined
above. Since livestock will often be housed during all or part of the year, there
is a need to connect livestock to housing, so that flows of C and N through the
manure management system can be followed.
The information required concerning livestock and manure
management is:
·
The
name of the livestock group.
·
If
the livestock can be housed, the list of housing types must be given.
·
If
livestock housing are given then for each housing type, a list of the manure
storage facilities (e.g. slurry tank, dung heap) that can receive manure must
be given.
Parameters are associated with all farm components. The
following parameter files are used:
·
constants.xml
– this contains parameters that the user will normally not need to change.
·
feedstuff.xml
– this contains the details of the crop products and feed items that can be
made available to the livestock.
·
fertMan.xml
– this contains details of the chemical composition of fertilisers and manures.
·
parameters.xml
– this is the largest file and contains parameters covering all other aspects
of the farm components.
The parameters are specific for the Agro-ecological zone
selected by the user. However, it is possible to specify farm-specific
parameter files by uploading them to the server using the Upload facility on
the Farm tab (Fig 1).
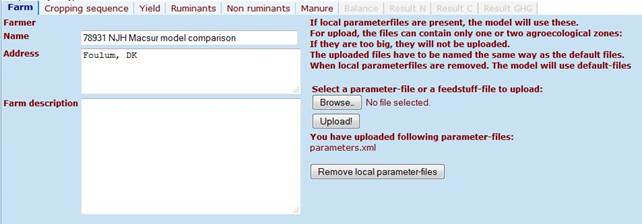
Fig 1 The Farm tab
As indicated by the ‘xml’, the files are XML files. Details
on how to edit these files is given below.
Details of the individual parameter files are given below. The
parameters are sometimes arranged hierarchically into groups. Each group and
parameter has a name, so in Fig 2 (from the parameter file feedstuff.xml),
beneath each agro-ecological zone, there are parameters for a number of
feedstuffs. These are arranged in a hierarchy, so that there are a large number
of groups with the name ‘feedItem’, each of which contains data on an
individual feedstuff. Beneath this are other groups that describe the different
characteristics of the feed. The lowest level in the hierarchy normally
consists of a value, a unit and a description.
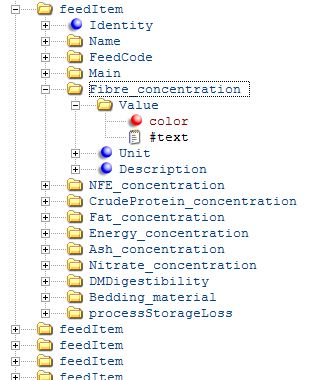
Fig 2 Example of XML hierarchy, shown with some groups
expanded
This format is quite flexible; in some cases, parameter
groups can appear more than once e.g. there will usually be a range of
livestock types present within an agro ecological zone, whilst in other cases,
more than one parameter group must be present e.g. the parameter group
Month must appear 12 times in the parameters.xml file, since this group
specifies the monthly climatic data. In the following tables, the name of the
group immediately beneath the agro-ecosystem is referred to as Tag level 1, the
next level as Tag level 2 etc.. If ‘*’ is inserted in the ‘>1’ column of the
table, the group of parameters can or must appear more than once in the file.
These are structured text files, so can be edited using any
text editor. However, users may find that an editor that recognises the
structural aspects of XML files may make editing easier. An editor was
developed to enable the FarmAC parameter files to be edited. This is available
from the web interface. Alternatively, there are a number of such programs
available for free or at reasonable cost (e.g. XMLNotepad or Editpad Pro).
If using a standard text editor to edit XML files, then you
should be aware that these files are structured using tags. In the following
example, the tag ‘Identity’ is opened in the brackets <…> and closed
again in the brackets <\..>.
<Identity color="red">1</Identity>
Important note: some tags will appear more than once e.g.
the Month tag must appear 12 times in parameters. xml. The Identity tag is used
by the model to search for parameters in the sequence, so if more than one tag
with the same name appears in the file, the values of the Identity tag must be
in numerical order, starting with 1.
This file contains a diverse range of parameter values that
the expert user will not normally need to change.
|
Tag level 1
|
Tag level 2
|
Description
|
Units
|
Example
|
|
humification_const
|
|
Proportion of degraded
carbon that is partitioned to humus-like organic matter
|
0
|
|
|
alpha
|
|
Concentration of carbon in
organic matter
|
none
|
0.46
|
|
spinupYearsBaseLine
|
|
Number of years that is used
in Ctool spinup of scenario if using adaptation (only if spinup is used)
|
years
|
0
|
|
spinupYearsNonBaseLine
|
|
Number of years that is used
in Ctool spinup of projection scenario (only if spinup is used)
|
years
|
0
|
|
absoluteGrazedDMtolerance
|
|
Threshold below which any
difference between production and consumption of grazed feed item is ignored,
irrespective of the percentage error
|
kg DM/ha
|
50
|
|
rgas
|
|
Universal gas constant
|
J/(mol K)
|
8.314
|
|
CNhum
|
|
C:N ratio of humus
|
none
|
12
|
|
tor
|
|
Proportion of manure C
degraded that is emitted as methane
|
none
|
0.5
|
|
Eapp
|
|
Apparent activation energy
|
J/mol
|
112700
|
|
CO2EqCH4
|
|
CO2 equivalent of CH4-C (100
year)
|
kg CO2 equivalents/kg CH4-C
|
28
|
|
CO2EqN2O
|
|
CO2 equivalent of N2O-N (100
year)
|
kg CO2 equivalents/kg N2O-N
|
468.3
|
|
CO2EqsoilC
|
|
CO2 equivalent of carbon
emitted as CO2 (100 year)
|
kg CO2 equivalents/kg C
|
3.667
|
|
IndirectNH3N2OFactor
|
|
Emission factor for N2O
emission from redeposited NH3 emissions
|
kg N2O-N emitted/kg NH3-N
emitted
|
0.01
|
|
IndirectNO3N2OFactor
|
|
Emission factor for N2O
emission from leached NO3-N - IPCC (2006)
|
kg N2O-N emitted/kg NO3-N
leached
|
0.0075
|
|
defaultBeddingCconc
|
|
Concentration of carbon in
default bedding dry matter
|
kg C/kg DM
|
0.4
|
|
defaultBeddingNconc
|
|
Concentration of nitrogen in
default bedding dry matter
|
kg N/kg DM
|
0.0064
|
|
InventorySystem
|
|
IPCC 2006
|
none
|
1
|
|
InventorySystem
|
|
FarmAC
|
none
|
2
|
|
ErrorToleranceYield
|
|
Maximum difference between
expected and modelled DM yield of crops
|
none
|
0.02
|
|
ErrorToleranceGrazing
|
|
Maximum proportional
difference between grazed crop DM and grazed crop intake
|
none
|
0.02
|
|
C-Tool
|
|
C-Tool parameters
|
|
|
|
timeStep
|
Time step of model (normally
one day)
|
year
|
0.00274
|
|
NumOfLayers
|
Number of soil layers
(currently not used i.e. fixed in code)
|
none
|
4
|
|
FOMdecompositionrate
|
Decomposition rate of fresh
organic matter
|
per year
|
1.44
|
|
HUMdecompositionrate
|
Decomposition rate of humic
organic matter
|
per year
|
0.0336
|
|
ROMdecompositionrate
|
Decomposition rate of
resistant organic matter
|
per year
|
0.000463
|
|
fCO2
|
Proportion of degraded humic
and resistant organic matter emitted as CO2
|
none
|
0.628
|
|
ROMificationfraction
|
Proportion of degraded humic
organic matter that is partitioned to resistant organic matter
|
none
|
0.012
|
|
transportCoefficient
|
Proportion of degraded
organic matter transported to next layer
|
none
|
0.03
|
|
EFNO3_IPCC
|
|
Leaching fraction - IPCC
(2006)
|
kg N2O-N/kg manure N
|
0.3
|
|
fert_EFNH3_IPCC
|
|
Emission factor for NH3 and
NOx - IPCC (2006)
|
kg NH3-N or NOx-N/kg
fertiliser N
|
0.1
|
|
man_EFNH3_IPCC
|
|
Emission factor for NH3 and
NOx - IPCC (2006)
|
kg NH3-N/kg manure N
|
0.2
|
|
adaptationTimePeriod
|
|
Minimum length of the period
over which flows will be calculated when using adaptation mode
|
years
|
500
|
|
minimumTimePeriod
|
|
Minimum length of the period
over which flows will be calculated when using projection mode
|
years
|
10
|
|
maximumIterations
|
|
Maximum number of iterations
of crop production before model gives up and generates an error
|
none
|
50
|
This file contains the details of the crop products and feed
items that can be made available to the livestock. Details of the chemical
characteristics of locally-available feed items will usually be available from
national livestock feeding tables. Most of these parameters will need to be
altered when defining a new feed item.
|
Tag level 1
|
Tag level 2
|
Description
|
Units
|
Example
|
>1
|
|
feedItem
|
|
|
|
|
*
|
|
|
FeedCode
|
Unique integer identifier
|
|
|
|
|
Main
|
Is true if this item is the
main product of the crop
|
none
|
FALSE
|
|
|
Fibre_concentration
|
The concentration of lignin
(=acid detergent fibre)
|
kg/kgDM
|
0.104
|
|
|
NFE_concentration
|
Concentration of
nitrogen-free extract (=sugar and starch)
|
kg/kgDM
|
0.069
|
|
|
CrudeProtein_concentration
|
Concentration of crude
protein (= 6.25 times nitrogen concentration)
|
kg/kgDM
|
0.515
|
|
|
Fat_concentration
|
Concentration of fat
|
kg/kgDM
|
0.035
|
|
|
Energy_concentration
|
Concentration of digestible
energy
|
MJ/kgDM
|
16.3409
|
|
|
Ash_concentration
|
Concentration of ash
|
kg/kgDM
|
0.073
|
|
|
Nitrate_concentration
|
Nitrate concentration
|
kg/kgDM
|
0
|
|
|
DMDigestibility
|
Dry matter digestibility
|
kg/kgDM
|
0.8
|
|
|
Bedding_material
|
Is true if this item can be
used as bedding
|
Boolean
|
FALSE
|
|
|
processStorageLoss
|
Proportion of DM, C and N
lost during processing or storage
|
-
|
0
|
|
This contains the details of the fertiliser and manure that
can be imported to a farm. The composition of mineral N fertilisers will
usually be standard for a particular country whereas the chemical composition
of manure can vary widely. The data in this table are only used directly if manure
is imported into the farm; the values for home-produced manure will be provided
by the model.
|
Tag level 1
|
Tag level 2
|
Description
|
Units
|
Example
|
|
fertiliser
|
|
|
|
|
|
Nconcentration
|
Concentration of nitrogen
|
kg N/kg fertiliser
|
0.335
|
|
Cconcentration
|
Concentration of carbon
|
kg C/kg fertiliser
|
0
|
|
manure
|
|
|
|
|
|
TANconcentration
|
Concentration of ammonium
nitrogen
|
kg NH4-N/kg manure fresh
weight
|
0.0033
|
|
organicNconcentration
|
Concentration of organic
nitrogen
|
kg organic-N/kg manure fresh
weight
|
0.0007
|
|
degCconcentration
|
Concentration of
readily-degradable organic carbon degC
|
kg/kg manure fresh weight
|
0.009
|
|
nonDegCconcentration
|
Concentration of resistant
organic carbon
|
kg//kg manure fresh weight
|
0.009
|
|
humicCconcentration
|
Concentration of humic
carbon
|
kg/kg manure fresh weight
|
0
|
This contains parameters covering all other aspects of the
farm components not dealt with in the other parameter files.
The main parameters to consider changing are:
·
The SandFraction and ClayFraction in the SoilType group. These
values can usually be obtained from local experts or soils databases.
·
The SoilWater group must contain 4 layerClass groups,
representing layers of soil. The z_lower of each of these groups must be
greater than the previous and the value of z_lower in the last of these
represents the maximum depth of the soil.
·
The initial of each type of farm (arable, pig, cattle). If in
doubt, choose a value equal to half the soil organic matter content.
·
The data in the Month group (For guidance on obtaining these data,
see Climate data).
·
The following data for livestock; isRuminant, isDairy,
Liveweight, milkNconc, milkFatconc, weightGainDairy Age and Mortality. The milkAdjustmentCoeff
is used to adjust the modelled milk production to match measured values.
·
The following data for housing; EFNH3housingTier2, feedWasteFactor,
beddingFactor.
·
The following data for manure storage; StoresSolid, EFNH3storageIPCC,
EFN2OstorageIPCC.
·
All crop data (For guidance, see Crop
parameters).
·
For manure applications; EFNH3FieldTier2 and NH3ReductionFactor.
·
NumberRaindays (For guidance on obtaining these data, see Climate data).
|
Tag level 1
|
Tag level 2
|
Tag level 3
|
Tag level 4
|
Description
|
Units
|
Example
|
>1
|
|
SoilType
|
|
|
|
Type of soil
|
|
Coarse sandy soil
|
*
|
|
N2Factor
|
|
|
Dinitrogen emission factor
|
kg N2-N/kg N2O-N emitted
|
3
|
|
|
ThermalDiffusivity
|
|
|
Thermal diffusivity of soil
|
metres squared per second
|
9E-07
|
|
|
SandFraction
|
|
|
Fraction of sand
|
kg/kg soil
|
0.95
|
|
|
ClayFraction
|
|
|
Fraction of clay
|
kg/kg soil
|
0.034
|
|
|
C-Tool
|
|
|
C-Tool parameters for arable
soil
|
|
|
|
|
|
InitialC
|
|
Initial carbon content in
soil
|
kg/ha
|
85000
|
|
|
|
InitialCtoN
|
|
Initial C:N ratio of soil
|
none
|
10
|
|
|
|
InitialFOMinput
|
|
Annual input of fresh
organic matter (FOM) to be used in model initialisation
|
kg C/ha/yr
|
1000
|
|
|
|
InitialFOMCtoN
|
|
C:N ratio of FOM input to be
used in model initialisation
|
none
|
15
|
|
|
|
pHUMupperLayer
|
|
Proportion of humus organic
matter (HUM) in topsoil
|
fraction
|
0.6
|
|
|
|
pHUMlowerLayer
|
|
Proportion of humus organic
matter (HUM) in subsoil
|
fraction
|
0.6
|
|
|
SoilWater
|
|
|
Parameters for soil water
model
|
|
|
|
|
|
layerClass
|
|
Hydraulic characteristics of
a soil layer (Identity = 1 for surface layer) Not currently used
|
|
|
*
|
|
|
|
z_lower
|
Depth below the soil surface
of the lower boundary of the layer
|
m
|
0.1
|
|
|
|
|
fieldCapacity
|
Field capacity (maximum
water holding capacity)
|
100 * cubic metre/cubic
metre
|
40
|
|
|
|
drainageConst
|
|
Rate at which water in
excess of field capacity drains from any given layer
|
mm per day
|
0.4
|
|
|
Month
|
|
|
|
Monthly mean weather data
|
|
|
*
|
|
AirTemperature
|
|
|
Average monthly air
temperature 2 metres above ground
|
Celsius
|
27.6
|
|
|
Precipitation
|
|
|
Average monthly
precipitation
|
mm
|
0
|
|
|
PotentialEvapoTrans
|
|
|
Average daily
evapotranspiration for this month
|
mm per day
|
5.69
|
|
|
GrazingMidpoint
|
|
|
|
Midpoint for grazing
|
Day
|
180
|
|
|
AverageAirTemperature
|
|
|
|
Average annual air
temperature 2 metres above ground (used only if monthly averages are not
available)
|
Celsius
|
15
|
|
|
AirTemperatureMaxDay
|
|
|
|
Julian day when air
temperature is at its maximum (used only if monthly averages are not
available)
|
Days
|
105
|
|
|
AirTemperaturAmplitude
|
|
|
|
Maximum deviation of air temperature
from the mean (used only if monthly averages are not available)
|
Celsius
|
15.1
|
|
|
Livestock
|
|
|
|
Details of livestock
|
|
|
*
|
|
SpeciesGroup
|
|
|
To which species group
livestock belongs (1 = cattle, 2 = pigs)
|
1
|
|
|
|
efficiencyProteinMilk
|
|
|
The efficiency with which
dietry protein is converted to milk protein
|
0.7
|
|
|
|
LivestockType
|
|
|
Subdivision of species group
|
1
|
|
|
|
isRuminant
|
|
|
true if the livestock are
ruminants
|
none
|
TRUE
|
|
|
isDairy
|
|
|
true if the livestock are
dairy animals
|
none
|
FALSE
|
|
|
Liveweight
|
|
|
Mean live weight of
livestock
|
kg
|
300
|
|
|
mu_base
|
|
|
Energy intake below which
there is no reduction in utilisation of energy
|
Proportion per unit of
energy intake, normalised by maintenance energy demand
|
0.25
|
|
|
mu_b
|
|
|
Rate of reduction in energy
utilisation with increasing energy intake
|
Proportion per unit of
energy intake, normalised by maintenance energy demand
|
0
|
|
|
milkCconc
|
|
|
Concentration of carbon in
milk
|
kg/kg
|
0.05
|
|
|
milkNconc
|
|
|
Concentration of nitrogen in
milk
|
kg/kg
|
0.00512
|
|
|
milkFat
|
|
|
Concentration of fat in milk
|
g/kg
|
50
|
|
|
growthNconc
|
|
|
Concentration of nitrogen in
animal growth
|
kg/kg
|
0.026
|
|
|
growthCconc
|
|
|
Concentration of carbon in
animal growth
|
kg/kg
|
0.232
|
|
|
maintenanceEnergyCoeff
|
|
|
Coefficient in calculation
of maintenance energy requirement
|
none
|
1.2
|
|
|
growthEnergyDemandCoeff
|
|
|
Energy requirement per unit
growth
|
MJ/kg
|
24.3
|
|
|
milkAdjustmentCoeff
|
|
|
Increases (>1) or
decreases (<1) the energy required to produce a litre of milk
|
none
|
1
|
|
|
urineProp
|
|
|
Proportion of carbon in diet
is excreted in urine
|
kg/kg
|
0.04
|
|
|
weightGainDairy
|
|
|
Weight gain of dairy animals
|
kg per year
|
0
|
|
|
HousedDuringGrazing
|
|
|
Is true if animals are
housing during part of the day when grazed
|
None
|
FALSE
|
|
|
Age
|
|
|
Mean age of livestock
|
years
|
6
|
|
|
entericTier2MCF
|
|
|
Methane conversion factor
|
kg methane per MJ energy
intake
|
0.07
|
|
|
Mortality
|
|
|
Proportion of livestock
dying on the farm
|
-
|
0.029
|
|
|
nitrateEfficiency
|
|
|
Efficiency with which
nitrate in feed reduces enteric methane emissions
|
kg methane oxidized per kg nitrate
|
0.8
|
|
|
Housing
|
|
|
|
Details of livestock housing
|
|
|
*
|
|
HousingRefTemp
|
|
|
Reference temperature for
ammonia emission factor (Tier 3 - not currently used)
|
Celsius
|
10
|
|
|
EFNH3housingRef
|
|
|
Ammonia emission factor for
housing (Tier 3 - not currently used)
|
kg ammonia N/kg ammonium in
housing
|
0.294
|
|
|
EFNH3housingTier2
|
|
|
Ammonia emission factor for
housing (Tier 2)
|
kg ammonia N/kg ammonium in
housing
|
0.2
|
|
|
feedWasteFactor
|
|
|
Proportion of feed dry
matter that is wasted in housing (enters manure)
|
kg DM/kg DM
|
0.15
|
|
|
ProportionDegradable
|
|
|
Proportion of degradable
carbon partitioned to solid manure storage, if more than one manure store is
used
|
0
|
|
|
|
ProportionNondegradable
|
|
|
Proportion of non-degradable
carbon partitioned to solid manure storage, if more than one manure store is
used
|
0
|
|
|
|
ProportionTAN
|
|
|
Proportion of ammoniacal N
partitioned to solid manure storage, if more than one manure store is used
|
0
|
|
|
|
beddingFactor
|
|
|
Rate of use of bedding dry
matter
|
kg dry matter/animal/day
|
0
|
|
|
ManureStorage
|
|
|
|
Details of manure storage
|
|
|
*
|
|
StoresSolid
|
|
|
Is true if this storage
stores solid manure
|
TRUE
|
|
|
|
b1
|
|
|
Coefficient in manure carbon
degradation (Tier 3 - not currently used)
|
None
|
1
|
|
|
lnArr
|
|
|
Log natural in Arrhenius
equation
|
None
|
40
|
|
|
meanTemp
|
|
|
Mean air temperture during
storage period
|
Celsius
|
28.079
|
|
|
Bo
|
|
|
Methane producing capacity
|
cubic metres methane/kg
volatile solids
|
0.24
|
|
|
ohmTAN
|
|
|
Proportion of manure TAN
lost by runoff or leaching
|
None
|
0
|
|
|
ohmOrg
|
|
|
Proportion of manure lost by
runoff or leaching
|
None
|
0.05
|
|
|
EFNH3storageRef
|
|
|
Ammonia emission factor
|
kg/kg
|
0.032
|
|
|
MCF
|
|
|
methane conversion factor
|
none
|
0.035
|
|
|
EFNH3storageIPCC
|
|
|
Ammonia emission factor IPCC
system
|
kg/kg
|
0.8
|
|
|
EFN2OstorageIPCC
|
|
|
N2O emission factor IPCC
system
|
kg/kg
|
0.02
|
|
|
EFN2OstorageRef
|
|
|
N2O emission factor nonIPCC
system
|
kg/kg
|
0.02
|
|
|
lambda_m
|
|
|
N2 emissions as a multiple
of N2O emissions
|
none
|
3
|
|
|
StorageRefTemp
|
|
|
Reference temperature for
ammonia emission factor
|
Celsius
|
10
|
|
|
PropGasCapture
|
|
|
Proportion of gaseous
emissions captured
|
None
|
0
|
|
|
TypeStored
|
|
|
Type of manure stored
|
2
|
|
|
|
Crop
|
|
|
|
Details of crops
|
|
|
*
|
|
NfixationFactor
|
|
|
Rate of reduction in N
fixation with increasing mineral N availability
|
kg N/kg mineral N available
|
-1
|
|
|
HarvestMethod
|
|
|
|
|
|
|
|
|
PropAboveGroundResidues
|
|
Above-ground yield of dry
matter that cannot be harvested
|
kg DM/kg DM
|
0.11
|
|
|
PropBelowGroundResidues
|
|
|
The below-ground crop
residues (e.g. roots), as a proportion of the DM yield
|
kg DM/kg DM
|
0.24
|
|
|
BelowGroundCconc
|
|
|
Carbon concentration in
below-ground dry matter
|
none
|
0.47
|
|
|
MaximumRootingDepth
|
|
|
Maximum rooting depth, if
not restricted by soil depth
|
metres
|
2
|
|
|
BelowGroundCtoN
|
|
|
Ratio of carbon to nitrogen
in below-ground dry matter
|
none
|
33
|
|
|
UrineNH3EF
|
|
|
|
Urine NH3 emission factor
|
kg NH3-N/kg urine N
|
0.15
|
|
|
CropResidues
|
|
|
|
Emission factors for crop
residues
|
|
|
|
|
EFN2O
|
|
|
Nitrous oxide emission
factor for crop residues
|
kg N2O-N/kg N
|
0.01
|
|
|
EFN2O_burning
|
|
|
Nitrous oxide emission
factor for burnt crop residues (Table 2.5 Guidelines V4_02_Ch2_Generic.pdf)
|
kg N2O-N/kg DM
|
0.00007
|
|
|
EFNOx_burning
|
|
|
NOx emission factor for
burnt crop residues from Guidebook (assume as NO2)
|
kg N2O-N/kg DM
|
0.0025
|
|
|
EFNH3_burning
|
|
|
Ammonia emission factor for
burnt crop residues from Guidebook
|
kg NH3-N/kg DM
|
0.0013
|
|
|
EFBlackC_burning
|
|
|
Black carbon emission factor
for burnt crop residues from Guidebook
|
kg C/kg DM
|
0.0005
|
|
|
EFCO_burning
|
|
|
CO-C emission factor for
burnt crop residues from Guidebook
|
kg NH3-N/kg DM
|
0.0286
|
|
|
MineralisedSoilN
|
|
|
|
Emission factors for
mineralised soil N
|
|
|
|
|
EFN2O
|
|
|
Nitrous oxide emission
factor
|
kg N2O-N/kg N
|
0.01
|
|
|
Fertiliser
|
|
|
|
Emission factors for
fertilisers
|
|
|
|
|
EFN2O
|
|
|
Nitrous oxide emission
factor
|
kg N2O-N/kg N
|
0.01
|
|
|
EFN2O_IPCC
|
|
|
Nitrous oxide emission
factor
|
kg N2O-N/kg manure N
|
0.01
|
|
|
FertiliserType
|
|
|
Details of emission factors
for a specific type of nitrogen fertiliser
|
|
|
*
|
|
|
EFNH3
|
|
Ammonia emission factor
|
kg NH3-N/kg N
|
0.02
|
|
|
Manure
|
|
|
|
Emission factors for manures
|
|
|
|
|
EFN2O
|
|
|
Nitrous oxide emission
factor
|
kg N2O-N/kg manure N
|
0.01
|
|
|
EFN2O_IPCC
|
|
|
Nitrous oxide emission
factor
|
kg N2O-N/kg manure N
|
0.005
|
|
|
N2Factor
|
|
|
Dinitrogen emission factor
|
kg N2-N/kg N2O-N emitted
|
3
|
|
|
ManureType
|
|
|
Details for individual
manure type
|
|
|
*
|
|
|
EFNH3FieldRef
|
|
Reference ammonia emission
factor
|
kg/kg
|
0.15
|
|
|
|
EFNH3FieldTier2
|
|
Reference ammonia emission
factor
|
kg/kg
|
0.2
|
|
|
|
EFNH3FieldRefTemperature
|
|
Temperature for reference
ammonia emission factor
|
Celsius
|
15
|
|
|
ManureApplicationTechnique
|
|
|
|
Details for individual
manure application method
|
|
|
*
|
|
NH3ReductionFactor
|
|
|
Reduction in ammonia
emission relative to broadcast spreading
|
none
|
0
|
|
|
NumberRaindays
|
|
|
|
Total number of rainy days
per year
|
80
|
|
|
5.5.1 Climate
data
The parameter NumberRainDays is used to divide rainfall into
a discrete number of rainfall events. Over-estimating the number of events will
tend to increase drainage whereas an under-estimation will tend to
over-estimate evaporation. It is preferable to focus on those events that contribute
significantly to the input of water (i.e. events where precipitation is above
about 10 mm day-1). Data describing the number of days with
significant rainfall may be available locally. If not, the paper by Sun et al
(2006; http://dx.doi.org/10.1175/JCLI3672.1)
may be of assistance.
Monthly climate data can be obtained for many locations from
FAO.
First, download and install Climwat (http://www.fao.org/nr/water/infores_databases_climwat.html).
Step 1
Run Climwat.
Step 2
Choose your country.
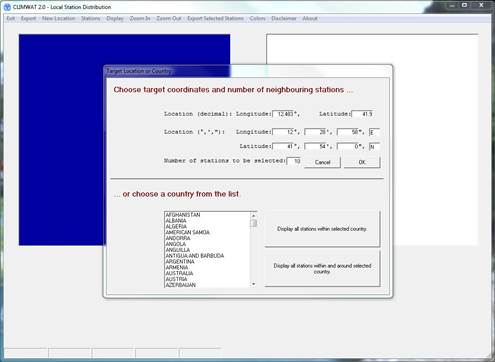
Step 3
Choose your location.
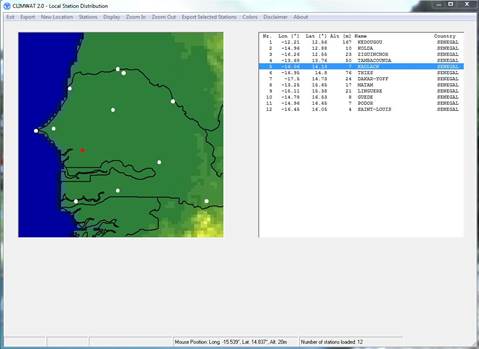
Step 4
Choose Export selected stations and download the files:

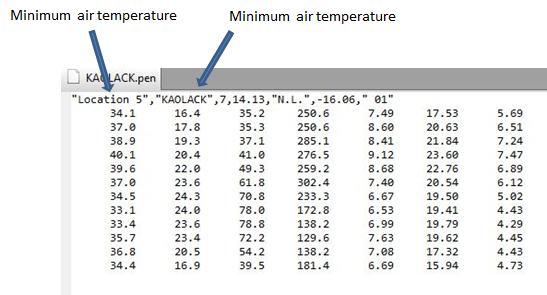
Step 5
Open the .pen file. The first row of numbers contains data
for January, the second row February etc. The first column contains the minimum
air temperature and the second contains the maximum (both in Celsius).
Calculate the air temperature as the average of the maximum and minimum values.
Step 6
Open the .cli file. The rows contain the monthly data. The
first column contains the potential evapotranspiration, the second he
precipitation (both in mm d-1).

5.5.2 Crop
parameters
The above- and below-ground crop residues are the main
sources of C input to the soil model. The above-ground residues consist of
those residues that are deposited onto the soil surface before the harvesting
date (mainly senescent leaves and tiller death due to self-thinning) and those
that are deposited at the time of harvesting (stubble, dust, small straw
particles and uncollected straw/cut roughage). The below-ground residues
consist of roots and root exudates.
The value of the maximum rooting depth (MaximumRootingDepth)
should be set after discussion with local crop experts.
The value of the C content in below ground DM (BelowGroundCconc)
can be estimated as 0.46 kg C (kg DM)-1.
Based on Danish research, we recommend the values shown in
Table 1.
Table 1 Parameters determining the above and
below ground crop residues
|
Crop types
|
Stubble*
|
Residues deposited prior to harvest
|
PropAboveGroundResidues
****
|
PropBelowGroundResidues
****
|
|
|
Proportion of yield
of main and secondary products
|
|
Cereals
|
0.15
|
0.35
|
0.5
|
0.38
|
|
Root crops
|
0.06
|
0.01
|
0.07
|
0.14
|
|
Grass and grass/clover**
|
0.15
|
0.27
|
0.42
|
1.17
|
|
Whole-crop cereal silage
|
0.16
|
0.18
|
0.34
|
0.45
|
|
Trees and shrubs***
|
0.07
|
0.07
|
0.11
|
1.11
|
* for trees and shrubs, this is the stump mass
**grass grown to maturity (heading) should be parameterised as
if it were a cereal crop
*** if no foliage or wood is removed, use ‘incorporation’ to
add them to the soil
***these parameters can be found in the FarmAC
parameters.xml file, under each crop
Table 2 Standard values of below-ground C:N to
use in FarmAC
|
Crop
|
Root C:N*
|
|
Grass and cereals
|
33
|
|
White clover
|
13
|
|
Other legumes
|
18
|
|
Trees and shrubs
|
60
|
* the parameter BelowGroundCtoN can be found in the FarmAC
parameters.xml file, under each crop